Individual vs Company Report
The Individual vs Company Report reveals how a specific user performs relative to their peers or organizational benchmarks. With side-by-side visuals and detailed data tables, it empowers managers to focus on tailored development, recognize unique strengths, and align individual efforts with team goals for maximum impact.
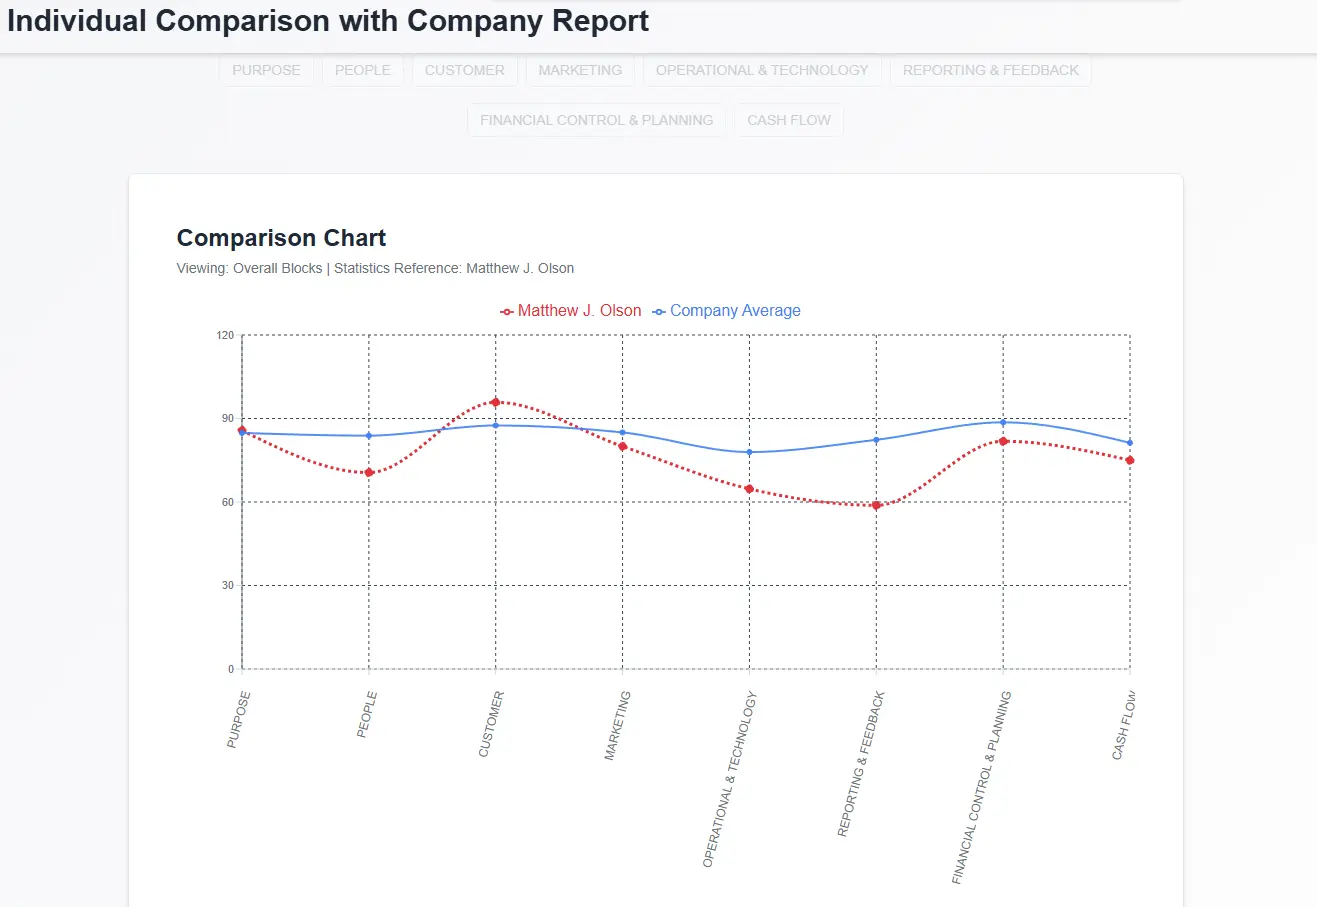
Block and Subblock Level Comparison Chart
This visual line chart compares an individual's performance block-by-block against the company average. It helps identify whether a user is leading, lagging, or aligned with organizational benchmarks. With intuitive markers and tooltip insights, it simplifies identifying targeted areas for coaching or recognition. It also provides subblock-level comparison for a more granular performance breakdown.
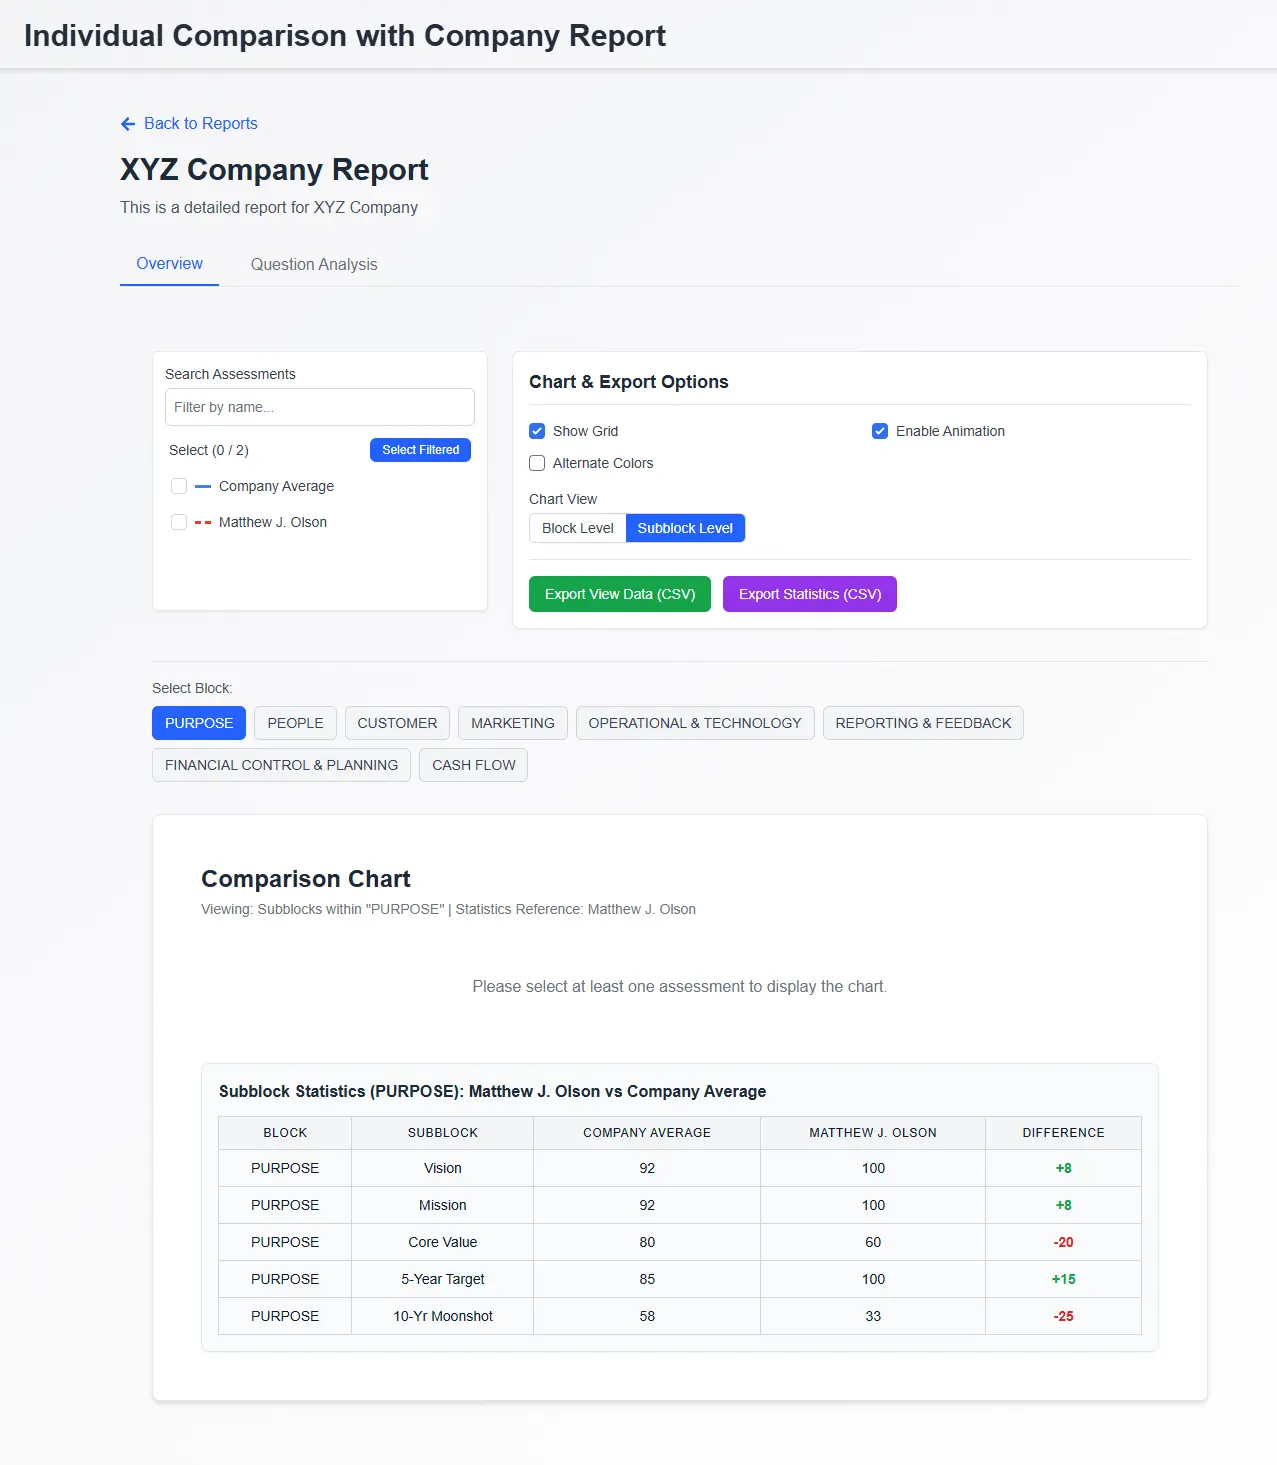
Block and Subblock Level Statistics Table
The tabular view presents a side-by-side numerical comparison between an individual and the company average across all assessment blocks. Color-coded differences clearly highlight strengths and weaknesses. In addition to block-level insights, it also offers subblock-level comparison to ensure more precise and data-backed decision-making.